
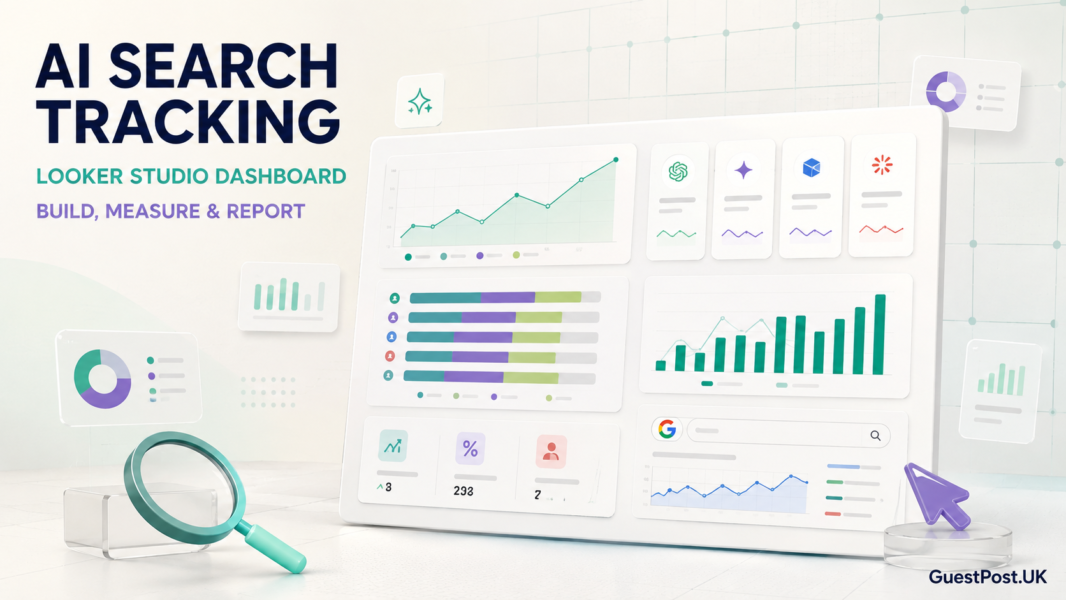
AI search visibility is difficult to manage when data lives in separate places. Your SEO team may have rankings in one tool, Google Search Console in another, AI mentions on a GEO platform, and referral traffic hidden in GA4.
A Looker Studio dashboard brings those signals together. It gives your business or clients one clear view of whether AI platforms are mentioning the brand, citing its website, sending referral visitors, or recommending competitors instead.
The aim is not to replace ordinary SEO reporting. It is to show how AI search fits alongside organic clicks, impressions, rankings, branded searches and business outcomes. A brand mention in ChatGPT may be encouraging, but it becomes commercially useful only when it supports stronger visibility, qualified traffic or conversions.
This guide explains how to build a practical AI search-tracking dashboard in Looker Studio for your business or your SEO clients.
Start with the right dashboard goal
Before adding charts, decide what question the dashboard should answer.
For most businesses, the question is not simply, “How many AI mentions did we receive?” A better question is:
Are AI platforms increasingly recommending, citing and sending relevant users to our business compared with our main competitors?
That shifts the dashboard from a vanity report into a decision-making tool.
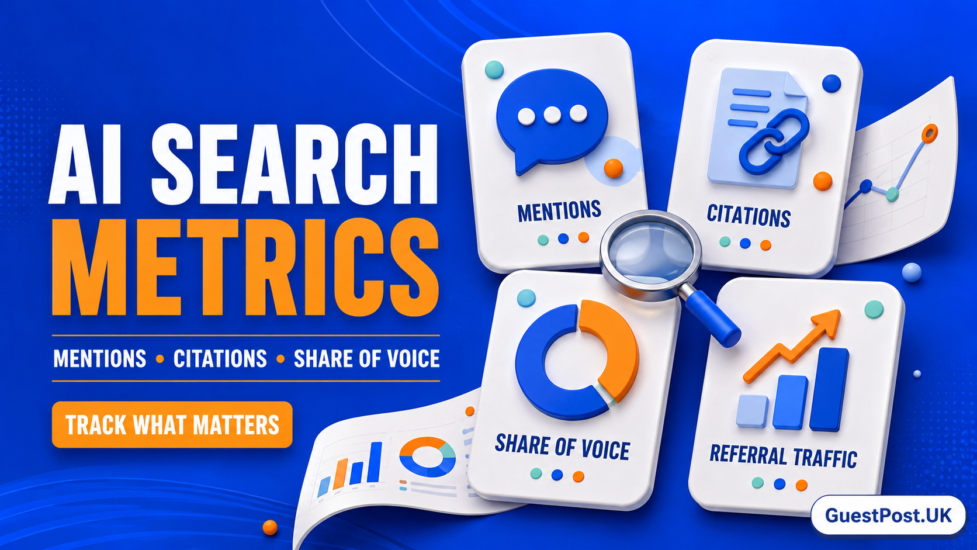
Your dashboard should reveal:
- Whether your brand appears in relevant AI answers
- Which AI platforms mention or cite you
- Which competitors have stronger AI visibility
- Which pages and external sources AI systems rely on
- Whether AI referral traffic is increasing
- Whether conventional SEO performance supports the same topics
- What action should be taken next
Keep the scope focused. A dashboard overloaded with 30 charts rarely helps a client understand what to do.
Choose your data sources
A useful AI search-tracking dashboard typically combines four data sources.
1. Your AI visibility platform
Use an AI visibility tool such as Otterly AI, Peec, Profound, Scrunch AI, Ahrefs Brand Radar or Semrush AI Toolkit. The exact connector will vary, but the data you need is broadly similar:
- Date
- AI platform or model
- Prompt
- Brand visibility or mention status
- Brand position
- Competitor mentions
- Sentiment
- Citations
- Cited domains
- Cited URLs
- Country or market
- Topic category
Some platforms have a native Looker Studio connector, API or export option. If direct integration is unavailable, export the data to Google Sheets on a regular schedule. Google Sheets is often enough for a small business dashboard, while larger agencies may prefer an API, BigQuery or a reporting connector.
2. Google Search Console
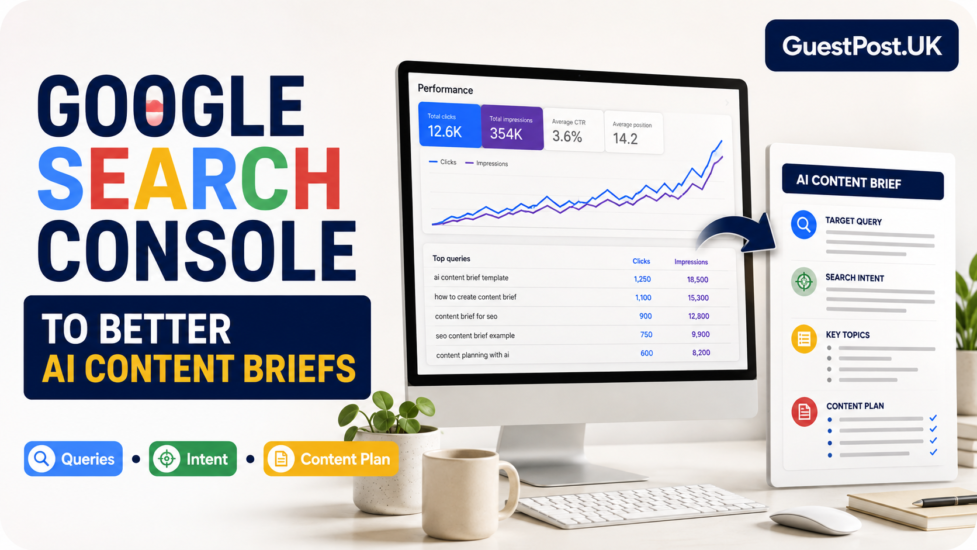
Google Search Console should sit beside AI visibility data, not underneath it. Its native Looker Studio connector can show clicks, impressions, click-through rate, average position, queries and landing pages.
This context matters. If an important service page is earning more Google impressions and also begins receiving AI citations, you have a stronger signal than an isolated AI mention.
Connect the relevant Search Console property, then select a consistent reporting period. For page-level analysis, choose the URL-impression table. For keyword trends, use site-impression data.
3. GA4 referral traffic
GA4 helps you see whether AI tools are actually delivering website visitors. Create a report that filters traffic sources for platforms such as ChatGPT, Perplexity, Gemini, Copilot and Claude where referral data is available.
Track:
- Sessions from AI referrals
- Engaged sessions
- Key events or conversions
- Landing pages
- Engagement rate
- Revenue, leads or enquiries where configured
Do not assume all AI visibility produces referral traffic. Many AI interactions are zero-click. The dashboard should show that reality honestly rather than trying to force a direct attribution story.
4. A structured Google Sheet
A simple Google Sheet is useful for manually maintained information that does not come through a connector. Include tabs for:
- Priority prompts
- Core competitors
- Important service or product pages
- Content published or updated
- Digital PR and guest post placements
- Monthly campaign actions
This helps you connect activity with outcomes. For example, you may see that a page started receiving citations after it was rewritten, supported with internal links and mentioned on relevant third-party websites.
Build the dashboard in five sections
A clean dashboard can be built across five pages or five clearly separated sections within a single report.
AI visibility overview
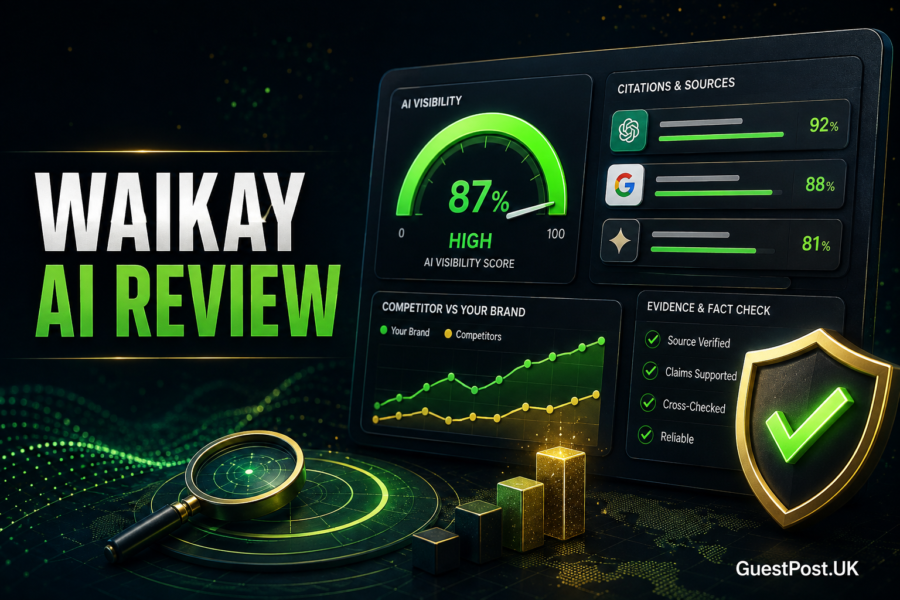
This is the executive-summary section. Use scorecards and a simple trend chart.
Include:
- AI visibility score or percentage
- Total brand mentions
- Number of tracked prompts
- Number of AI platforms tracked
- Citation count
- Competitor share of voice
- AI referral sessions
- Change compared with the previous period
Add a short text insight below the charts. For example:
“Brand visibility increased across ChatGPT and Perplexity this month, while citations remain concentrated around competitor comparison prompts. The next priority is improving product and service pages that answer these questions directly.”
That one paragraph makes a client dashboard far more useful.
Platform and prompt performance
Create a table that breaks performance down by AI platform: ChatGPT, Google AI Mode, Google AI Overviews, Perplexity, Gemini, Claude or whichever systems your tool supports.
Use columns for:
| Platform | Brand mentions | Visibility % | Average position | Citations | Sentiment |
|---|---|---|---|---|---|
| ChatGPT | |||||
| Perplexity | |||||
| Google AI results |
Then add a prompt table showing the most commercially relevant questions. Group prompts by topic, such as “service”, “pricing”, “best provider”, “alternative” and “comparison”.
This is where you will spot the opportunities that actually matter. A business being mentioned for a broad informational prompt is positive, but appearing for “best [service] in [location]” is often more valuable.
Competitor visibility
This section should compare your brand with three to five genuine competitors. Do not include every company in the market; that turns the report into noise.
Add a bar chart for share of voice, then a table with:
- Brand
- AI visibility
- Mentions
- Citation count
- Average position
- Positive sentiment
- Most common cited domains
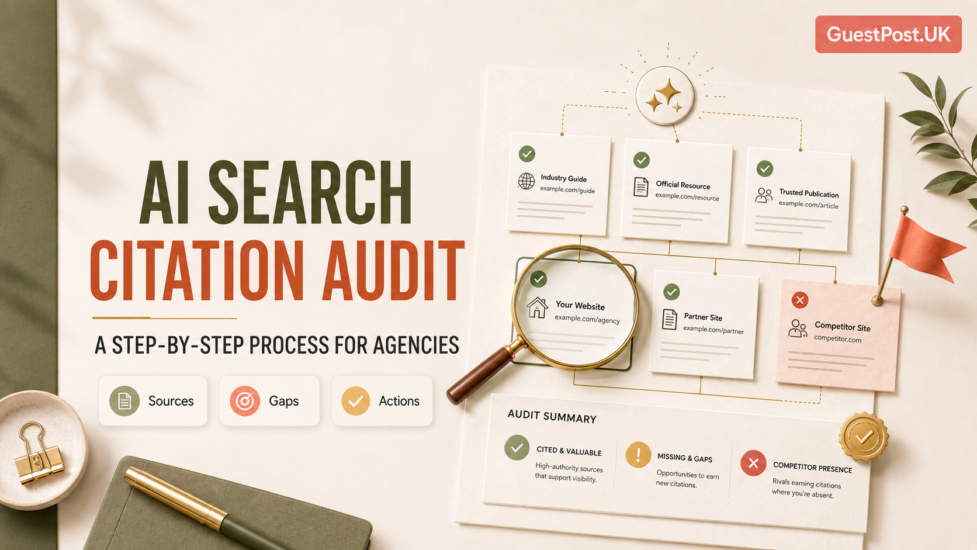
The cited-domain column is particularly valuable. If competitors are repeatedly supported by trusted review sites, publisher coverage, specialist directories or original research, that provides a clear digital PR and link-building brief.
For relevant businesses, this is where a well-planned guest posting campaign can support stronger brand signals beyond the company’s own website.
Citation and content opportunity analysis
AI systems frequently rely on third-party content as well as brand websites. Use this section to show:
- Your most-cited URLs
- Competitor most-cited URLs
- External domains cited most often
- Missing topics or prompt groups
- Pages with growing Google impressions but no AI citations
- Pages receiving AI citations but weak organic performance
A useful chart here is a bubble chart or simple opportunity table. It should flag prompts where competitor visibility is high but your brand visibility is low.
| Opportunity | Evidence | Recommended action |
|---|---|---|
| “Best [service] for [audience]” | Competitors repeatedly recommended | Publish or improve a comparison-led service page |
| Pricing prompts | Competitor pages cited | Add clear pricing explanation and FAQs |
| Local prompts | Review sites dominate citations | Improve location pages, reviews and local citations |
| Product questions | AI cites third-party guides | Create expert product comparisons and supporting content |
SEO, referral traffic and outcomes
The final section shows whether visibility is translating into commercial progress.
Include:
- Organic clicks and impressions from Search Console
- AI referral sessions from GA4
- Branded search trend
- Leads, enquiries or sales
- Priority-page performance
- Content and outreach activity during the period
Use a date-range control and previous-period comparison. Looker Studio controls allow viewers to change dates and filter the report, which is helpful for agencies managing several locations, services or campaigns.
Add calculated fields carefully
Calculated fields help turn raw exports into useful metrics. Looker Studio supports calculated fields for creating new dimensions and measures from your source data.
Examples include:
Mention rate
SUM(Brand Mentions) / SUM(Prompt Checks)
Citation rate
SUM(Brand Citations) / SUM(Prompt Checks)
Positive sentiment rate
SUM(Positive Mentions) / SUM(Brand Mentions)
AI referral conversion rate
SUM(Conversions) / SUM(AI Referral Sessions)
Use calculated fields only where the underlying data is reliable. If a platform calculates its own proprietary visibility score, display it as reported rather than attempting to recreate it with incomplete data.
Use consistent prompts and reporting periods
AI results can change based on wording, location, model updates, retrieval behaviour and timing. That means an AI visibility dashboard is not a fixed ranking report.
Use the same prompt set, market, competitors and platforms each month. Review the actual captured answers as well as the score. A movement from 20% to 30% visibility may look positive, but it matters more if the brand has started appearing for high-intent buying prompts.
A practical starting point is 30–50 prompts split across:
- Core services or products
- Brand and competitor comparisons
- “Best” and recommendation-led questions
- Pricing and alternatives
- Problem-led customer questions
- Local or industry-specific searches
Final checklist
Before sharing the dashboard with a client, check that it has:
- A clear date range and comparison period
- Only commercially relevant prompts
- Three to five real competitors
- AI visibility beside Search Console and GA4 data
- Citation examples, not only scores
- A clear action section for the next month
- No unsupported claims that AI visibility directly caused revenue
- Proper viewing permissions and no sensitive information exposed
All in All!
A good AI search tracking dashboard does not pretend that answer engines are easy to measure. It gives you a repeatable way to identify visibility trends, competitor advantages, citation opportunities and content gaps.
Start simple. Connect your AI visibility data, Google Search Console, GA4 and a structured action sheet. Then use the dashboard monthly to make better decisions about service pages, content, technical SEO, digital PR, and authority building.
If your business is visible in AI search results but not converting, improve your landing pages. If competitors are cited more often, study their content and external coverage. If AI bots cannot understand your pages, resolve the technical issues first. That is how an AI visibility report becomes an effective GEO strategy rather than another dashboard that nobody opens.